Control charts use sequential data to describe a process. If two or more samples are taken periodically and sequentially, and the average of the measurements is plotted with respect to time, those points make a run chart. By adding upper control and lower control limits the run chart is transformed into a Statistical Control Chart.
The construction of a control chart is as
follows given a set of sequential data:
1. Calculate the average of each sample and denote it as Xbar, also calculate the average of all those averages. Denote this as X2bar. Calculate the range (highest observation value minus lowest observation value) for each sample and denote this as R. In addition, find the average of all the R’s and denote this as Rbar. e.g.,
|
Sample - k |
1 |
2 |
3 |
Xbar |
|
R |
|
|
2 |
3 |
4 |
3.00 |
|
2.00 |
|
|
7 |
4 |
6 |
5.67 |
|
3.00 |
|
|
2 |
5 |
2 |
3.00 |
|
3.00 |
|
|
|
|
X2bar |
3.889 |
Rbar |
2.67 |
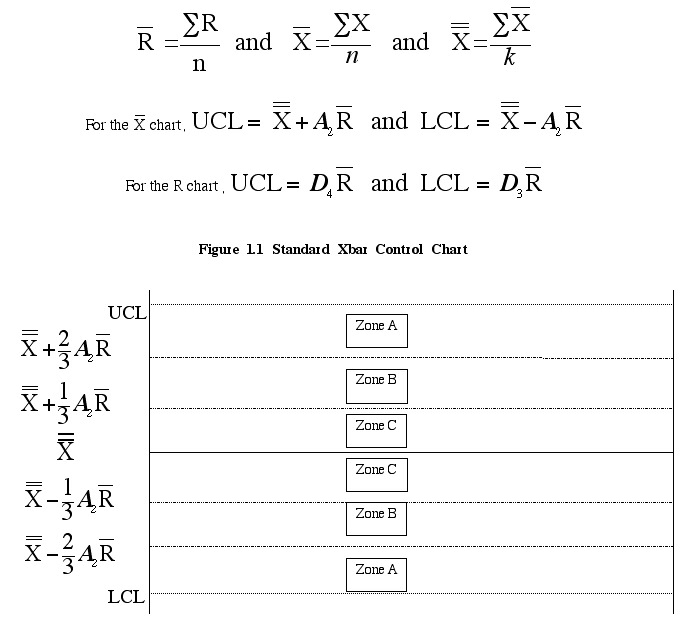
2. Using X2bar and Rbar calculate the process control limits - upper and lower &emdash; for the Xbar and R charts. These limits are calculated as follows. Use Table 1.1 to locate values for A2, D3, and D4. Remember n = # of observations. If LCL equals zero there is no need for construction of the zones below the center line.
3. A standard xbar control chart is constructed using the following formulae. Figure 1.1 displays and example of an xbar chart.
|
|
|
|
|
|
|
|
|
|
|
|
|
|
|
|
|
|
|
|
|
|
|
|
|
|
|
|
|
|
|
|
|
|
|
|
|
|
|
|
|
|
|
|
|
|
|
|
|
|
4. After construction of the control chart, all sample points should be plotted, with the x-axis being time and the y-axis being in the units of the sample.
5. Interpret the control chart using the following rules: A process is OUT-OF-CONTROL if any of the following are seen
a. One point beyond the UCL or the LCL limitb. Eight points in a row anywhere on one side of the centerline
c. Six points in a row steadily increasing or decreasing
d. Fourteen points in a row alternating up and down
e. Two out of three points in a row in the Zone A or beyond
f. Four out of five points in a row in Zone B or beyond
6. An R chart should then be constructed using the formulae provided earlier for R UCL and R LCL. R bar is used as a center line. The R chart is then analyzed for trends or points beyond the UCL or LCL. If trends or points beyond the UCL or LCL exist the process may be out-of-control or some type of nonrandom cause may have been introduced to the process.