Chapter 12 - WILD LIVING RESOURCES: PLENTIFUL AND ENDANGERED
 The Big Picture
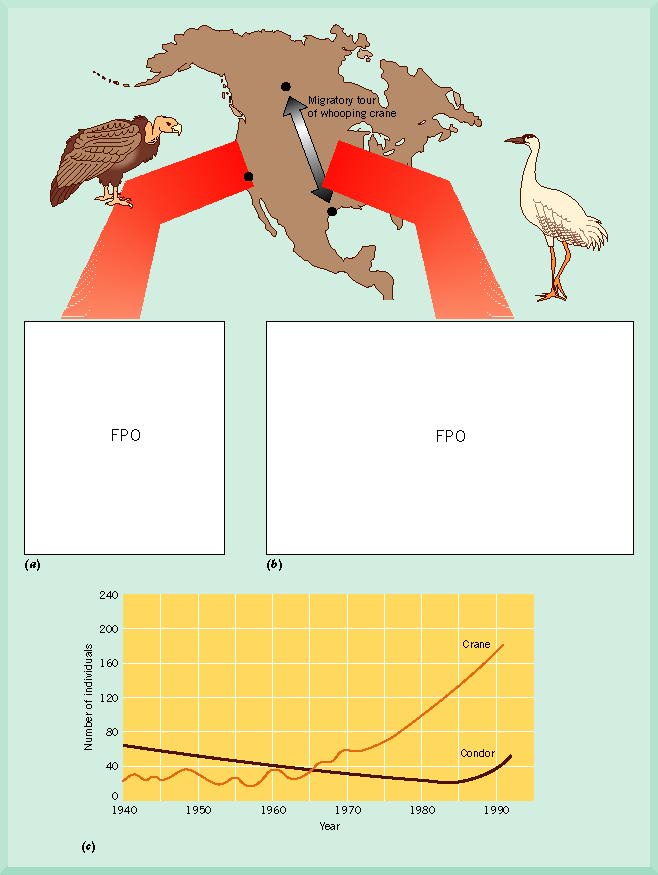
The wild living resources on Earth include wildlife, fish populations, plants, and other biota. These species may be harvested by humans for use as food, in making drugs, and as articles of clothing and fashion. Other species simply provide ecological services, such as scavenging, decomposing, acting as a predator, or as a producer. Some of these species are very abundant and other species are uncommon. Some may be on the brink of extinction; these are endangered species. Abundant species that are harvested by humans can be managed using mathematical models initially developed by foresters to determine the rate of maximum harvest. The harvest that will produce the largest yield over the time period specified is determined with a Maximum Sustainable Yield (MSY) model. These MSY models are now used by natural resource managers for fish and wildlife populations. Management of populations that are on the brink of extinction requires a different approach than management of the abundant species. Endangered species must be protected using special recovery programs that preserve the species' habitat and remove human hunting, fishing or other influences. In some cases, when the species population is so reduced that there are just a few remaining and its natural habitat is altered, intensive captive breeding programs may be undertaken so that the few remaining individuals can be carefully monitored and allowed to reproduce without interference. Any new offspring can be reared away from predators or dangers from human activities in the natural habitats that may kill them. The Case Study on American Whooping Cranes and California Condors compares how such endangered species may respond differently to management using these two approaches (Figure 12.1). The Whooping Crane has gradually increased from 14 individuals in 1937 to 183 birds in the wild today; its natural habitat was in good shape when the recovery plan was implemented. The California Condors natural habitat is altered by humans, so that, of the eight captively reared birds that have been released, three were later killed by power lines or water pollution. These two contrasting cases illustrate that the recovery of any endangered species is not guaranteed and may be impossible for some species. In this chapter, the authors describe the causes of extinction, compare modern extinction rates to past rates, examine the traits shared by many endangered species, and demonstrate that the risk factors for extinction are increased by human technology and the human population's size. In addition, the concepts of carrying capacity, MSY models, minimum viable population sizes, minimum viable habitat, and other approaches used in wildlife management will be discussed.
 Frequently Asked Questions
What is conservation biology?
- Conservation biology is the applied science of deciding what species to protect, determining what their habitat requirements are, developing strategies to protect them, and using various habitat conservation plans and technologies to prevent species from going extinct.
- Goals of conservation biology are to do at least one of the following for an endangered species (in decreasing order of preference):
- To protect breeding populations of the species in a wild habitat.
- To protect breeding populations of the species in a managed habitat.
- To preserve a population of the species in a zoo so that the genetic characteristics are maintained.
- To preserve the genetic material (frozen cells) only so that the species may later be cloned.
Why protect endangered species?
- Species cannot be replaced if they go extinct. Thus, we may want to have the species later on, even if we don't know how to value it right now. (As Aldo Leopold once wrote: "....to keep every cog and wheel is the first precaution of intelligent tinkering.")
- Ecological Justification
- We should protect species because of their roles in ecosystems as producers, predators, decomposers, scavengers, and keystone species. We should assume that every species has an ecological role and thus an ecological value, even though we may not understand the role yet.
- Utilitarian Justification
- We should protect species because they produce a useful product for humans (desirable genetic characteristics, medicine, food, clothing, shelter, tools, fuel). Tourism is such a useful product (people pay a lot of money to view endangered species and biological diversity; consider whale-watching and rainforest tours). Pollution control is accomplished with some species of microbes, plants, and animals; for example, bioremediation is a process of using bacteria to clean up toxic chemical spills.
- Aesthetic and Cultural Justification
- We should protect species for their aesthetic value and their beauty. Certain majestic species, such as the American bald eagle, are protected in part because of an aesthetic and cultural value; the eagle is a national symbol of strength in the USA. Because many people will visit beautiful regions with such species, preserving beautiful endangered species can lead to tourist dollars in the local economy (utilitarian justification).
- Moral and Ethical Justification
. - Species have a moral right to exist beyond any human needs. If we consider humans to be the stewards of the Earth and all the life on it, then we have a moral and ethical commitment to protect all species, independent of our need for them.
How many endangered species are there?
- There are 5876 threatened and endangered animal species on the International Union for the Conservation of Nature (IUCN) list.
- This total combines the species in the categories Endangered (1182 species), Vulnerable (1479 species), Rare (1144 species), and Indeterminate (2070 species).
- There are 15,780 species of plants listed as threatened by the IUCN.
- The number of individuals remaining in each species varies by species and is not known precisely for any species.
- There are more endangered mollusks and insects than any other group of species of animals (See Table 12.1. in text).
What does the Endangered Species Act do?
- The Endangered Species Act of 1973 made it illegal to trade in endangered species or products made from them.
- It also made it illegal to harass, harm, or capture an endangered species or destroy its habitat.
- All federal agencies were required to prevent further loss of endangered species by using their authorities to conserve endangered species and their ecosystems.
- The act authorizes the US Fish and Wildlife Service to create endangered species recovery plans, which can restrict development planned for habitats of endangered species.
- The Act declared that endangered species of plants and wildlife "...are of aesthetic, ecological, educational, historical, recreational, and scientific value to the nation and its people".
What are some common traits of endangered species?
- Many are vertebrates
- Low reproductive rates (1-2 offspring per 2 years)
- Long-lived (50 or more years)
- Large body size
- Large home range
- High amounts of food required per individual
- Top of food chain carnivores (wolves, sharks)
- Large herbivores (elephants)
- Specialist species (i.e., panda bears only eat bamboo leaves)
What is the difference between threatened and endangered status?
- Under the Endangered Species Act, a threatened species is one that is in danger of going extinct in part of its natural range, but is still common in other parts of its range.
- An endangered species is in danger of going extinct throughout its range.
Are there any species that have been taken off the endangered list?
- Since 1973, only six species have been removed from the endangered species list in the USA, including the American alligator and the gray whale.
- However, another 1000 species have been added during the same time period.
- The net increase in listed species is due to the fact that habitat is being altered at an accelerating rate, that the recovery plans for endangered species have been underfunded, and the fact that new species are added as we learn more about their population sizes.
What is the difference between global extinction and local extinction?
- Local extinction is extinction of a population within a small area or region. For example, a species like the gray wolf may have once existed in your state, but is now locally extinct. The gray wolf still lives in Minnesota, Montana and Alaska.
- Global extinction
is extinction from the Earth. This is the normal meaning of extinction.
- Local extinctions precede global extinctions. It is the accumulation of many local extinctions that leads to global extinction.
Don't species go extinct naturally?
- All species eventually will become extinct, but many alive today would not be expected to go extinct so soon.
- Approximately 99 % of all species that have ever existed have gone extinct.
- The average longevity of a species in the geological record is 10 million years.
- Prior to the Industrial Revolution, rates of extinction have been low (1 species extinction/year)
- Current rates of extinction are much higher than this (100 - 1000 species extinctions/year)
During the "mass extinction" periods, the causes of which are uncertain but may be due to asteroid impacts or massive volcanic eruptions, 53 % of marine animal species went extinct (250 million years ago), and the dinosaurs went extinct (65 million years ago) (Figure 12.7).
What are the natural causes of extinction?
- After a population has become endangered because of various factors (See the Frequently Asked Question: "How do humans cause local extinction and global extinction?"), extinction can occur due to a number of factors:
- Population Risk
- Random variation in population birth rates and death rates can cause an already low population to decline to the point of extinction. This is especially true with species that have been reduced to a single population below 500 individuals.
- Environmental Risk
- Random variation in physical or biological environmental factors such as symbionts, food sources, predators, weather, can cause an already low population to decline to the point of extinction. For example, the heath hen went extinct because the population of goshawks, a predator, increased in the last remaining area where a preserve for the heath hen had been established.
- Natural Catastrophe
- Fires, floods, hurricanes, tornadoes, volcanoes, meteorite impacts are potentially capable of extirpating all individuals of a small population. If the population were the last one of a species, extinction would occur.
- Genetic Risk
- Genetic diversity within an already small population size is typically low. Changes in the genetic makeup of a population due to mutation or genetic drift (random loss of certain alleles from a population) can cause extinction (see Chapter 7).
How do humans cause local extinction and global extinction?
- Humans can cause species to become endangered, which can lead to extinction either locally or globally, in the following ways:
- Hunting and harvesting
- Humans prey upon animals and harvest plants to near extinction for sport, food, commercial sales of animal parts (fur, ivory tusks, etc.), or to control it as an unwanted pest species. The black rhinoceros and elephants are endangered because poachers hunt them for their ivory tusks, parrots are endangered as they are stolen from the jungle for use as pets, and passenger pigeon were driven to extinction by sport hunting.
- Habitat destruction
- Habitat for animals and plants is continually altered as humans encroach on wild areas. In a sense, as human "habitat" (cities, suburbs, farms, roads, shopping malls, etc.) expands, habitat for wild biota decreases. This is the major cause of species declines worldwide.
- Exotic species introduction
- Species from outside an area (exotic species) are introduced either intentionally or unintentionally and cause the extinction of native species. Examples of exotic species that are known to have caused extinctions of native species include the gypsy moth (intentional, for silk production), kudzu vine (intentional, for soil erosion control), walking catfish (intentional, for pets), the zebra muscle (unintentional in the ballast water of ships), Dutch Elm Disease (unintentional) and American chestnut blight (unintentional).
- Pollution of the environment
- Pollution from pesticides and other toxic chemicals can biomagnify and produce developmental abnormalities in populations of biota. As a result, natural rates of reproduction of these species decline. Biomagnification in the food chain of DDT sprayed to control mosquitoes caused the decline of the bald eagle and other raptors in the late 1970's.
Are we conserving individual species or total biological diversity?
- We are interested in conserving both, but these are somewhat different goals.
- For example, the conservation of spotted owls requires that we preserve old growth forest (see Chapter 13) , but we may also want to preserve the greatest number of species as possible. This might require us to manage for early forest successional stages as well as old growth.
- Another example comes from the Everglades, where the Endangered Species Act prevents any alteration of an endangered species habitat. The Snail kite, an endangered hawk-like bird, nests in some areas that will be altered if water flow is restored in the Everglades to the natural levels. Overall biodiversity will be protected better if the natural flows are restored, but the snail kite populations may suffer.
What is wildlife management?
- Wildlife resources are managed largely by managing the habitat and harvest rates on wildlife populations.
- The goal of wildlife management is to maintain sustainable harvests of wild animals from natural habitats.
- In the past, the harvests were done mostly for sport or subsistence hunting.
- Recently, a management goal of "game ranching" has been added in some areas. "Game ranching" is a practice of allowing wild species like zebras and impalas to grow on natural habitat, then harvesting commercially.
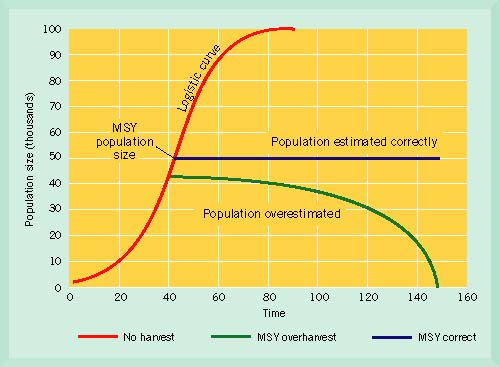
What is the logistic growth curve?
- This concept was originally introduced in Chapter 5.
- The logistic growth curve is the S-shaped curve typically used in mathematical models of population growth. A plot of this curve shows time (t) in years (for most populations) on the x-axis versus number of organisms in the population at each time period (N) on the y-axis. (Figure 12.13).
- The population following a logistic growth curve starts out growing nearly at an exponential rate, but then gradually slows due to competition for food and shelter resources among individuals in the population as the logistic carrying capacity (K) of the environment is reached. This is the maximum number of organisms that can be maintained indefinitely in that environment if the population meets the assumptions of the logistic model. K is the asymptote of such logistic plots.
- The logistic curve has been widely used in modeling populations of fishes, trees, wildlife, and even humans. Demographers use the logistic curve to predict K or the maximum number of organisms that will be in an area.
- However, very few organisms follow the curve exactly, and the assumptions made by scientists in order to use the model are rarely achieved in nature.
- The logistic model assumes that the population size at any time period can be determined solely by the density of the population at the previous time period; this is unlikely to be true in all cases.
- It is rare that populations stabilize at a single value of K, but rather they fluctuate as weather, interactions with other species, and random factors in ecosystems change the carrying capacity.
What is the Maximum Sustainable Yield?
- Maximum Sustainable Yield (MSY) is a mathematical model based on the logistic equation for a population; K is estimated from population growth data.
- Harvest limits are determined by assuming that the population is growing at its maximum rate at one half of the carrying capacity or K/2, and using the growth rate of the population at K/2 as the harvest amount.
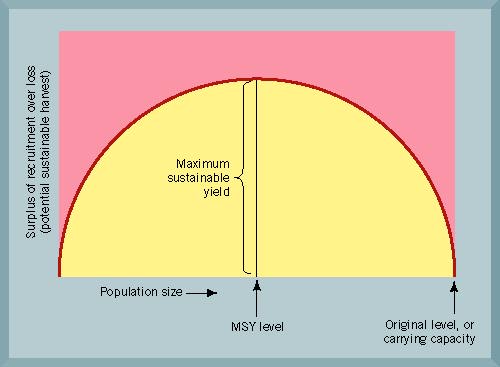
- Another way to visualize the MSY model and the underlying logistic is to plot the population growth rate or the potential sustainable harvest (also called the surplus of recruitment over loss, yield per recruit, annual percentage increase in population) versus population size (N) (Figure 12.14). The population size is x-axis in this figure, but it was the y-axis in Figure 12.13. This curve shows a low potential harvest at small and large values of N, i.e, when the population is large or small. This is when the population growth rate is minimal. At intermediate sizes of N, specifically at N= K/2, the population has the greatest potential sustainable harvest. The potential sustainable harvest at N=K/2 is called the maximum sustainable yield.
Is the MSY model appropriate for managing wildlife and fisheries?
- The traditional view of wildlife and fishery managers was that the assumptions of the MSY model were largely met, and that the model was an appropriate choice for setting sustainable harvest rates.
- Many managers are coming to grips with the reality that natural populations do not follow the logistic growth curve, that populations are affected by changes in the physical and biotic environment as well as the harvest rate and the number of individuals in the population at the previous time interval.
- These realities of fluctuating populations make the managers jobs much more difficult, because the exact size of the population cannot be predicted, so harvest rates must be set conservatively. If the population is actually smaller than the logistic would predict, then the population could be overharvested, because the MSY would allow for too large a harvest.
- Many natural resource management failures, especially in fisheries with fish populations that are highly variable due to climatic variations, can be attributed to the exclusive reliance on MSY models.
- A better approach involves using Optimal Sustainable Yield models.
What is the Optimal Sustainable Yield and how does it differ from Maximum Sustainable Yield?
- Optimum Sustainable Yield (OSY) is a model for determining a harvest level that considers other factors besides the logistic growth curve and the maximum sustainable yield (MSY).
- OSY takes into consideration factors such as environmental variability of the ecosystem and effects on other species in the ecosystem.
- For example, OSY was used by the International Whaling Commission as a way of maximizing the population size rather than the harvest rate for whales. OSY has determined that harvest rates should be zero for a while for endangered species of whales. A MSY model would have predicted at least some amount of harvest could be done, even though it might have been just a few whales.
What is the minimum viable population size?
- The minimum viable population size is the smallest number of individuals that have a reasonable chance of persisting.
- A population size of 50 breeding individuals must be maintained in order to avoid inbreeding and genetic drift (random loss of genetic material) problems.
- Because most individuals do not breed (they are too young or too old), a safety factor is added to this minimum. A population should be at least 500 breeding individuals or 10 times the number of breeders that is needed to avoid genetic problems.
- Nature preserve areas are influenced by this figure. Because large animals need more habitat space than small animals to obtain their food, nature preserves must reflect the minimum population size multiplied by the home range for the largest species. For example, wolves need 26 km2 each to find food, so a minimum viable population would need 13,000 km2, or 5,000 mi2 , of nature preserve to maintain the 500 wolves. If a nature preserve that is large enough cannot be set aside, then the 500 population size may be maintained artificially by moving wolves into other populations periodically for breeding purposes.
 Ecology In Your Backyard
- What are the endangered species in your state? Every state has some endangered animals or plants that either are still present or have populations that have been driven to local extinction. Find out what species are still left in your area and see if you can help them by contributing money or time to a local conservation group or agency.
- Contribute to the non-game wildlife fund for your state. These funds are used to purchase land or restore habitat for endangered species. You can often check a box on your income tax or buy a special license plate to contribute to these funds.
- Join an environmental group like The Nature Conservancy. This group maintains a low profile, but is very effective at preventing the loss of critical habitats for endangered species. This group is made up of professional ecologists who are committed to protecting endangered species using nature preserves. Contributions are used to purchase land and keep it from being developed. Check out their website in the Ecolinks section below.
- Do you own a pet? If you do, do you know where it came from? Was it taken from the wild (as many birds, fish, reptiles, and other exotic species are) or was it bred in captivity? Most likely, if you have a dog or a cat, they were reared in captivity. If your pet is from the wild, do you know what the population status of your pet is? Find out if the species is native or exotic, and don't release it if its an exotic (This is especially true for fish and reptiles!). Is it a threatened or endangered species? See if you can find out below on the Ecolinks section in one of the endangered species lists.
- Please respond to these questions or send your thoughtful examples and comments to:
BackYard@wiley.com
The best responses will be posted on the Wiley Environet Website, so check the page regularly for updates to see if your e-mail is posted!
 Hardcopy Links In The Library
- Erwin, D. H. 1966. The mother of mass extinctions. Scientific American, July 1996, 275(1): 72-78.
- Hunter, M.L. 1990. Wildlife, Forests, and Forestry: Principles of Managing Forests for Biological Diversity. Prentice Hall. Englewood Cliffs, NJ.
- Perlin, J. 1989. A Forest Journey: The Role of Wood in the Development of Civilization. Harvard University Press, Cambridge.
- Robinson, S.K. 1996. Nest losses, nest gains. Natural History Magazine, July 1996, 105 (7): 40-47.
- Robinson, S. K. 1997. The case of the missing songbirds. Consequences 3 (1): 2 - 15.
- Terborgh, J. 1992. Why American songbirds are vanishing. Scientific American, May 1992.
- Terborgh, J. 1989. Where Have All the Songbirds Gone? Princeton University Press, Princeton, NJ 207 pp.
- Ward, P. 1994. The End of Evolution: A Journey in Search of Clues to the Third Mass Extinction Facing Planet Earth. Bantam Books, New York, 301 pp.
 Ecolinks On The Web
- http://www.gcrio.org/CONSEQUENCES/introCON.html - Consequences, The Nature & Implications of Environmental Change. This peer-reviewed journal about environmental change has the online version of the article by Scott Robinson on declines in some songbird species. Robinson, Scott K. 1997. The Case of the Missing Songbirds. Consequences 3 (1): 2 - 15.
- http://www.mbr.nbs.gov/bbs/bbs.html - The Breeding Bird Survey. This is a website for the Breeding Bird Survey, which is a continent-wide census of breeding birds that was begun in 1966. At this website, you may find interesting facts and create graphs of the decline in some songbird species, and the increases in others. (As populations change due to habitat loss, some species will actually increase as the disturbed habitats favor their populations). You can interactively review the results of this Breeding Bird Survey by state, by species of bird, and by larger region. If you are a birdwatcher, you will find this site fascinating, and you may participate in the survey.
- http://envirolink.org/issues/endangered.html - Envirolink's Endangered Species Page. View distribution maps of endangered species, the status of Endangered Species Act Reauthorization, pictures of endangered species and more.
- http://www.nr.usu.edu/gap/ - Gap Analysis page. GAP stands for Geographic Analysis Program. This website concerns the GAP analysis studies and other biodiversity studies at Utah State University and elsewhere.
- http://www.fws.gov - United States Fish and Wildlife Service. The chief US Agency charged with monitoring the Endangered Species Act.
- http://www.wcmc.org.uk/ - World Conservation Union Red List of Threatened Animals. Follow the links on this page to find out about the "red list", which lists all of the endangered species in the world.
- http://www.wwf.org/ - World Wildlife Fund. An environmental watchdog organization that monitors the status of endangered species.
- http://www.tnc.org/ - The Nature Conservancy. The premier environmental action fund in the world. They put their money where it can do the best for endangered species -- they buy the land and keep it from being developed by humans. Run by professional ecologists.
- Note: If any of these links are not working, please see if alternative links are available at the Ecolinks Update Site.
 Ecotest Online
1. The Endangered Species Act authorizes the US Fish and Wildlife Service to prepare a _________________ for each listed species.
a. recovery plan
b. list of known property owners that have the species on their land
c. wildlife preserve
d. captive breeding program like the one used for California Condors
2. A population of which of the following animals has the best chance of surviving in a small (< 10 ha) ecological reserve of appropriate habitat (i.e., one in which that species is normally found)?
a. Bengal tiger
b. Spotted owl
c. Gray wolf
d. White-footed mouse
3. There are more endangered _______________ than any other animal group worldwide.
a. birds
b. fishes
c. insects and mollusks
d. mammals
e. reptiles
4. Since the Endangered Species Act was passed in the United States, the number of listed species has:
a. decreased as conservation measures have improved.
b. decreased because of the extinction of many listed species.
c. decreased because of political pressures.
d. increased as new information about animal population dynamics has become available.
5. Since the American alligator was listed as an endangered species in 1967, its population has:
a. decreased to the point where extinction is inevitable.
b. remained about the same.
c. increased somewhat but is still in danger of extinction.
d. increased dramatically and is no longer considered endangered.
6. Many people enjoy simply observing, identifying, and learning about wildlife (nondomestic) species of plants and animals. In addition to these aesthetic uses, wildlife provide other benefits to humans, such as:
a. clothing from skins and furs.
b. drugs and medical products from wild plants.
c. food from sport hunting, fishing, and plant gathering.
d. All of these choices are true.
7. When plants and animals are introduced into areas that are completely new to them, they:
a. often become destructive pests.
b. often outcompete native animals.
c. often increase because they have few natural predators.
d. All of these choices are true
8. Which of the following is NOT a trait commonly associated with many endangered species?
a. large home range
b. high amounts of food required per individual
c. large body size
d. generalist food preferences
e. long-lived (50 years or more)
9. In the course of evolutionary history,
a. humans have caused most extinctions
b. about one-half of all species that have ever existed have gone extinct
c. extinction has only occurred in conjunction with meteor impacts
d. about 99 % of all species that have ever existed have gone extinct
e. none of these are correct
10. A utilitarian justification for protection of biological diversity in a tropical rainforest is:
a. A high diversity of birds will attract birdwatchers
b. Medicinal products may be derived from plants in the forest
c. Food items that may be grown for human consumption will be found
d. Climate conditions worldwide will be maintained if deforestation is stopped
e. All of these are utilitarian justifications
Back to Table of Contents