Chapter 5 - THE HUMAN POPULATION AS AN ENVIRONMENTAL PROBLEM
 The Big Picture
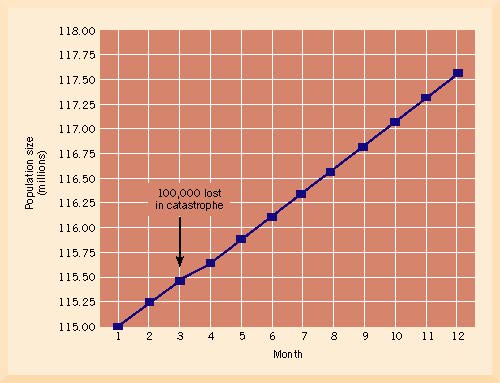
The human population is growing rapidly. Whereas the total human population on Earth was less than 250,000 people about 10,000 years ago during pre-agricultural times (or as many people as in a small city today), it is estimated that about 5.8 billion people will live on Earth by the end of 1997, many of them in developing countries where population growth rates are the greatest. For example, in Bangladesh (see Case Study), each year 2,860,000 people are added in excess of the number that died (the population there is growing by 2.4 % per year). Recently, a hurricane killed 100,000 people in Bangladesh (compare this number with the < 10 or so people killed in a hurricane when one hits the US coast). Afterwards, the population growth curve for Bangladesh barely showed a fluctuation because of this great natural disaster. (Figure 5.2). This underscores the magnitude of the population growth rate in Bangladesh. All over the world, people are being added to the planet at an average rate of 1.5 % per year, all the while consuming food, producing pollution, and causing changes to the environment. This may not seem like a lot, but the total number of people on Earth increases by about 87,000,000 people per year; that is roughly equivalent to the size of the population of Mexico. It has been said that this problem of overpopulation by humans is the greatest environmental problem facing the Earth. Because people in developing countries spend most of their time and money simply meeting their daily food requirements, no one in those countries with high population growth rates will be able to devote any effort to issues of protecting biological diversity, saving endangered species, conserving fisheries, or managing forests. In this chapter, the authors discuss the historical and current human population growth rate, the methods by which population growth is estimated, the impact of exponential growth rate, methods by which population control may be instituted, and finally, the controversy surrounding the methods of population control.
 Frequently Asked Questions
What is demography?
- Demography is the study of populations (from Greek, "demos" = population, "graphy" = to describe or draw).
- The demography of any plant or animal population can be done, but the authors concentrate on human demography in this chapter on human demography. Fishery biologists, foresters and conservation biologists all study the demography of particular fishes, trees, or endangered species.
- Because they and many human demographers are interested in population changes over time, it is often said that they study the population dynamics of a given species.
Who was Thomas Malthus?
- Reverend Thomas Malthus was a British minister, economist, and one of the world's first human demographers.
- In 1789, he published "An Essay on the Principle of Populations" in which he detailed the potential for growth in the human population.
- He predicted that the Earth's capability to produce food would be outstripped by human population growth.
- Thus, he was among the first demographers to put forth the concept that the population of humans has a limit to growth.
- He based his predictions on the population in London, which had been undergoing rapid population growth for some time, but was slowing during his lifetime. He noted increasing levels of homosexuality and sexual promiscuity without procreation (or vice as he called it) as the population grew and he predicted that this would serve in part to slow population growth. But his calculations on human population growth convinced him that this would not be enough to prevent overpopulation ("...the passion between the sexes is necessary and will remain nearly in its present state.."), and that eventually disease and famine would claim large numbers of people.
- So far, in the 200 years since his prediction, the world human population has continued to grow without limit. So, Malthus was wrong. However,...
Was Malthus right about the limits to human population growth?
- Strictly speaking, he has not been proven correct in most areas of the world, because world food supply has kept pace with the human population.
- The increased food supply has been due to the technological advances of the Green Revolution, which relied on intensive fertilizer and pesticide application to achieve high yields.
- In certain areas of the world, especially in Sub-Saharan Africa, the population has risen faster than the food supply, as can be seen in the declining grain production per capita in those regions. So in Sub-Saharan Africa, Malthus was right, but not elsewhere.
- These patterns may change in the future, and many pessimistic human demographers think that Malthus will eventually be proven correct.
What is the upper limit to the world's human population?
- No one knows for certain. It is unknown for three reasons:
- 1) the actual number of people on the Earth can only be roughly estimated, (routine censuses are done in only a few countries);
- 2) the human population has never been this large before, so that every day we are setting new records; and
- 3) it really depends on the standard of living the people on Earth maintain.
- If all 5.7 billion of us wanted to live like a typical US citizen, the number of people living would be far below where it is now. If we all live like people in developing nations, then we may have many more people.
- Estimates of the number of people that the Earth can support vary from 2.5 billion (this estimate is based on everyone living and eating like a US citizen, which means we have already exceeded the limit) to 40 billion (this assumes all available flat lands, even deserts and colder regions ns, are turned into farms).
- The World Bank estimates that the human population on Earth will stabilize at 10 - 12 billion people in the year 2140, but this prediction is based on the logistic growth curve (see "What is the Logistic Growth Curve?"). However, the logistic growth curve has not yielded correct estimates of the human population growth limit in the past.
What is exponential growth?
- Populations initially grow at exponential rates of increase. Exponential growth occurs when a population increases by a constant percentage each time period (multiplicative increase), rather than by a constant amount (additive increase).
- The series 2, 4, 8, 16, 32, 64, ... is an exponential series that increases by a mutiplicative factor of 2, whereas the series 2, 4, 6, 8 ,10, 12... is an arithmetic series that increases by an additive factor of 2.
- Because of the exponential nature of growth, population growth rates are reported as the percentage growth per year.
- Exponential growth is accelerating growth, so that the increases are small at first but large after a while.
- Exponential growth occurs in much the same way as a bank calculates interest on a loan or a savings account, the percentage change from year to year remains constant, but the absolute amount of money that one gains or pays in interest is ever increasing.
- The human population is currently growing exponentially at a rate of 1.5 % per year.
How is population growth measured?
- Population growth is measured as a change in the number of people or organisms per unit time.
- Human demographers normally standardize the growth rate by the number of new people added to a population per 1000 people per year. This is done in order to compare countries or areas with different total numbers of people and to use a year as the standard time unit.
- The following statistics are used to measure population growth rate:
Crude birth rate = b = the number of births/1000 people/year
Crude death rate = d = the number of deaths/1000 people/year
Immigration rate = i = the number of immigrants/1000 people/year
Emigration rate = e = the number of emigrants/1000 people/year
- The annual population growth rate, g, can be calculated as follows:
g = (b-d) + (i-e)
or the birth rate minus the death rate plus the immigration rate minus the emigration rate. Essentially, this is the same as subtracting the number of people dying or emigrating from an area from the number of new people added through birth or immigration into an area. Thus, death and emigration have the same impact on a population (they lower it), while birth and immigration both raise the population.
- As an example: If the country of Australia's birth rate is 15.9 births/1000 people, and its death rate is 7.5 deaths/1000 people, assuming that there are an equal number of immigrants and emigrants [thus, (i - e)= 0], what is the population growth rate g?
g = 15.9 - 7.5 = 8.4 people/1000 people, or 0.84 % annual increase
What is doubling time?
- Doubling time is the amount of time that it takes for an exponentially growing population to double, usually measured in years for human populations.
- Thus, when a population is growing at a rate of 2 % per year, it will take about 35 years to double. There is a simple formula that has been determined empirically that allows this quantity to be calculated:
Doubling time (in years) = T = 70/annual percentage growth rate for the population
- For our Australian example, this works out to:
T= 70 / 0.84 = 83.333 years
How rapidly is the human population growing?
- The human population for the entire Earth is growing at 1.5% per year, or 86 million people per year.
- There are about this many people in the country of Mexico, so the Earth gains about one Mexico's worth of people per year.
- The Earth's human population had been growing at a rate of 2.1 % during 1965-1970, but has slowed somewhat as population control measures have been implemented.
What is the doubling time for the world's human population?
- The Earth's human population will double in about 47 years, according to most recent estimates (1.5 % growth per year). This can be calculated as follows:
Doubling Time = (70/1.5) = 46.67 years
- This is an instantaneous rate, so that the doubling may occur sooner or later depending on how the growth rate changes in the future. But if the growth rate remains constant at 1.5 %, it will take 47 years for the Earth's human population to increase from 5.7 billion to 11.4 billion people.
What are some of the most rapidly growing countries?
- The Ivory Coast has a population growth rate of 3.8 % per year, which yields a doubling time of 18 years.
- China, the most populous country, is growing at a rate of 1.4 %, and it will double in size in 50 years.
What countries have low population growth rates?
- Belgium, Austria, Great Britain, and Germany grow at about 0.1 % per year, and thus their populations will double in 700 years. Essentially, the populations in these countries are no longer growing very much; they have stabilized.
- In Russia, the crude death rate exceeds the crude birth rate, so that the population is shrinking.
- In the United States, the growth rate was 0.9 % during the 1980's; thus the doubling time for the US was about 78 years.
What is the logistic growth curve?
- The logistic growth curve is the S-shaped curve typically used in mathematical models of population growth. A plot of this curve shows time (in years, for human populations) on the x-axis versus N, the number of organisms in the population at each time period, on the y-axis.
- The population following a logistic growth curve starts out growing nearly at an exponential rate, but then gradually slows as the so-called "carrying capacity" of the environment is reached. This is the maximum number of organisms that can be maintained indefinitely in that environment, and is often shown as an asymptote, K, of such plots.
- The logistic curve has been widely used in modeling populations of fishes, trees, wildlife, and even humans. Demographers use the logistic curve to predict K or the maximum number of organisms that will be in an area. However, very few organisms follow the curve exactly, and the assumptions made by scientists in order to use the model are rarely achieved in nature. It is rare that populations stabilize at a single value of K, but rather they fluctuate as weather, interactions with other species, and random factors in ecosystems change the carrying capacity.
- Nonetheless, human demographers have used the logistic curve to predict the carrying capacity for Earth. Estimates have varied depending on which assumptions about changing fertility rates are used (Figure 5.6). If the fertility rate is assumed to reach replacement level by year 2040, then the human population will stabilize at 15 billion by the year 2100.
- If replacement fertility rate is reached by 2000 (very unlikely), then the human population will stabilize at 8 billion people in 2100. It is not known which of these alternatives will occur; in fact, the actual growth is likely to be somewhere in between these two extremes (see the World Bank estimate above).
- A third possibility is that the human population will continue to grow exponentially until 2100; although this seems unlikely as well as undesirable (the population would be well over 20 billion by then).
What is the Total Fertility Rate (TFR) and how does it differ from the Replacement Fertility Rate?
- The total fertility rate is the average number of children born during a women's lifetime.
- The TFR can be as high as 9.0 in places like Rwanda, or 3.8 in the USA during the post World War II "baby boom" years. In the US now, this rate is approximately 1.9, which is close to the replacement rate.
- The replacement fertility rate is the fertility rate that exactly replaces a women and her spouse, on average.
- A population that maintains a replacement level population growth rate for a long period of time will stabilize; a population that exceeds replacement level will grow, a population that falls below the replacement level will decline.
- For humans, the replacement rate is typically around 2.0 children per lifetime, although it can be higher or lower depending on the infant mortality rate (which makes the replacement rate higher if it is higher) and the rate of growth of the population in the past (the replacement rate is 1.9 in the US because of the baby boom generation, which increased the past growth rate).
What is Zero Population Growth?
- When a population stabilizes, maintains a replacement level fertility rate, or has crude birth rates and death rates approximately equal for a long period of time, it is considered to be at ZPG or Zero Population Growth.
- Although this is a long-term goal for human demographers to achieve worldwide, it has been achieved only in developed countries like the US.
What is the demographic transition?
- The demographic transition is a pattern of change in birth rates and death rates that has been observed to occur in human populations (Figure 5.7).
- As human societies pass through a series of stages during cultural evolution, from hunter-gatherer societies to industrial age societies, it has been observed that birth rates and death rates are initially high and approximately equal in non-industrial, pre-agricultural human societies (Stage I).
- Death rates begin to decline during the agricultural stage (Stage II) of human society, as improved food availability, medical care, sanitation, the use of soap, and other technologies improve human survival.
- However, during the intermediate stage (Stage II), because of the "passion between the sexes" as Rev. Malthus put it, the birth rate usually remains high after the death rate falls. This leads to a rapid increase in population (birth rate greatly exceeds death rate).
- In Stage III of the demographic transition, birth rates fall to new low levels, approximately equal to death rates, in industrial and post-industrial societies. If birth rates remain low after this transition from Stage II to Stage III, the population will eventually stabilize and stop growing.
- Stage IV may occur in some post-industrial societies, in which chronic diseases, such as heart disease, are cured or long-term survivorship is improved. This would bring about an additional period of population growth.
- It is difficult for many developing nations, such as African and Arabic nations, to lower their birth rates after the death rate has fallen in the intermediate stage. Thus, many countries are still stuck in the intermediate, high-population growth stage (stage II), because they have high birth rates but low death rates. Population control advocates suggest that these nations must lower their fertility rates by various methods in order to reach ZPG.
What is the age structure of a population?
- The age structure of a population is the distribution of individuals among different ages (the proportion of individuals in each age class).
- Populations of different countries differ in their age structure. Rapidly growing populations (such as in countries like Kenya; Figure 5.9, left) tend to have many individuals in pre-reproductive age groups, which is less than age 15 in human populations. Some populations have a dominant age group, like the baby boomers in the US (Figure 5.9, center). Other populations that have reached a stable size have an equal number of individuals in all age groups, like in Austria (Figure 5.9, right).
- By constructing a plot of the age distribution of a population, demographers can determine the tendency of a population to grow or stabilize.
- It is also the age distribution that is used for many social and economic calculations, from deciding whether or not to build schools or retirement homes, to determining life insurance premiums.
What is population momentum?
- Even after a population has attained the replacement level fertility rate, it will continue to grow for several generations. Because a human generation is 30 years (time between mother and offspring), the effects of a burst of fertility can be felt for many years.
- This tendency for a population to grow even after the population controls have been applied is called population momentum or the population lag effect.
- The momentum can last anywhere between 50 and 200 years.
- The momentum is due to the effects of age structure.
- For example: women in the US alive today who are part of the baby boom are having children. Even if they each have 2 children (replacement rate), there are so many baby boomer moms that there will be a surplus of children the next generation - a baby boomlet. So, even though the US population has reached the replacement level fertility rate, the population will continue to grow for a while.
- Eventually, if the population maintains the replacement level fertility rate for a long while, the population will stop growing.
How can we stop human population growth?
- There are a number of ways to slow and stop population growth, should we decide to do so:
- Delay the age of first reproduction by women.
This will cause a major decrease in the total fertility rate. In nations with rapidly growing populations, most women marry before the age of 20. China's population was growing so rapidly in 1950 that it experienced a major famine. The leaders of China undertook a program of population control, which included laws setting a minimum for marriage ages (18 for women and 20 for men). As a result, the birth rate fell from 32 to 18 per 1000 people, and total fertility went from 5.7 to 2.1 children per female per lifetime.
- Educate women.
A natural and painless way to delay the age of first reproduction by women is by encouraging the education of females worldwide. This is the single most important factor in reducing the total fertility rate to replacement rate levels. Women who are educated and work outside the home have fewer children and make a greater income. There is a clear relationship between total fertility rate and income (Figure 5.10). As women make greater incomes, they have fewer children. And as they have fewer children, they make more money.
- Encourage women to use breast-feeding
. Women who feed their newborn infants with their breast milk will not ovulate, hence this prevents pregnancy. It is also healthy for the infant, and so this is another natural, painless method of population control.
- Encourage family planning.
This includes providing greater access to birth control, contraceptives, abortion, and sterilization. These latter two methods are the most controversial from a moral and ethical perspective. However, they are very significant in terms of reducing birth rates. Given the alternative of overpopulation and children dying of starvation after birth rather than before birth, these methods can really be viewed as humane.
- Migration
. Countries experiencing excessive population growth can encourage migration to other countries. Movement of displaced people via immigration has occurred in the past and has helped to build the populations of the USA, Australia, and New Zealand. War, famine, and natural disasters have all been know to trigger migration to other countries. This type of population redistribution may only occur when the country to which the people are immigrating welcomes them. This cannot continue in the future, because most countries already have too many people. For example, the political climate is changing in the USA, and immigration is no longer widely favored. Migration to undersea colonies or space stations, while theoretically possible, are unlikely to do much to prevent overpopulation of the Earth by one species, Homo sapiens.
 Ecology In Your Backyard
- What is the Total Fertility Rate in your area (state or local government)?
- Calculate the Total Fertility Rate for your family lineage. Determine the following: How many children did your mother have? How many children did your grandmothers and great-grandmothers have? If you are typical, the number of children produced by each of these women should have declined as family size decreased during the past generations. If you can, ask your mother and grandmother why she had the number of children she had. Were the births planned?
- How many children do you expect to have? Please state if you are you male or female.
- Please respond to these questions or send your thoughtful examples and comments to:
BackYard@wiley.com
The best responses will be posted on the Wiley Environet Website, so check the page regularly for updates to see if your email is posted!
 Hardcopy Links In The Library
- Cohen, J.E. 1995. How Many People Can the Earth Support? W.W. Norton and Company, New York
- Kent, M. M. and K. A. Crews. 1990. World Population: Fundamentals of Growth. Population Reference Bureau, Washington, DC.
- Sadik, N. The State of World Population. 1990. United Nations Population Fund Report, New York.
- World Bank, 1985. Population Change and Economic Development. Oxford: Oxford University Press.
- Hub, C. 1995. Global and US National Population Trends. Consequences, The Nature & Implications of Environmental Change, Volume 1 (2) : 3-11.
 Ecolinks On The Web
- http://forest.bio.ic.ac.uk/cpb/cpb/cpbintro.html - Centre for Population Biology (CPB). This is the Home Page for the United Kingdom's Natural Environment Research Council (NERC) Centre for Population Biology (CPB), which is a research group that is part of the Imperial College, London, England. This web site has research updates on population studies, and a database is being assembled of over 2000 studies of population growth over a diversity of species.
- http://www.prb.org/prb/ - Population Reference Bureau. A great source of human population statistics, such as total fertility rates, annual population growth rates, and crude birth and death rates for every county.
- http://www.gcrio.org/CONSEQUENCES/introCON.html - Consequences. The article listed above can be found here: Haub, Carl. 1995. Global and U.S. National Population Trends. Consequences, The Nature & Implications of Environmental Change, Volume 1 (2) : 3-11.
- Note: If any of these links are not working, please see if alternative links are available at the Ecolink Update Site.
 Ecotest Online
1. A study of the changes in the size of a population over time is called _________________________.
a. population dynamics
b. population census
c. age-distribution study
d. family planning study
2. Demography refers to:
a. the study of human populations
b. the study of any population
c. the census of a population
d. the age, sex, racial characteristics of a population of people
3. What did Malthus predict?
a. The human population will eventually exceed the ability of the Earth to produce food for them.
b. If trends in human population growth are true, we will always be able to feed everyone on Earth.
c. There are no limits to human population growth.
d. Although the population of London stopped growing, the world's population will not.
e. When population density gets high, homosexuality and vice increases
4. Have Malthus's predictions about population growth and food supply been proven correct?
a. Yes. All human populations in all countries have insufficient food.
b. Yes, but not in all areas of the world. Some human populations have enough food, but there have been famines elsewhere.
c. No. Humans populations have grown, but so have food supplies.
d. None of these are correct.
5. At what level will the human population reach a stable upper limit according to the World Bank?
a. 5.7 billion people in 2140
b. 10 - 12 million people in 2000
c. 10 - 12 billion people in 2140
d. 32 billion people in 2000
6. Which of the following series is an exponentially increasing series?
a. 2, 3, 4, 5, 6, 7, 8, ...
b. 2, 4, 6, 8, 10, 12, 14, ...
c. 2, 6, 10, 14, 18, 22, 26, ...
d. 2, 8, 24, 72, 216, 648, 1944, ...
e. none of these are exponentially increasing
7. If the birth rate in Bedsecksistan, a fictional former Soviet Republic, is 35 per 1000 and the crude death rate is 30 per 1000, what is the annual growth rate of this population?
a. 0.05 %
b. 0.005 %
c. 0.5 %
d. 5 %
e. -0.2 %
8. What is the population doubling time for humans in the nearby former (fictional) Soviet Republic of Gudsecksistan, a country that has a crude birth rate of 40 per 1000 and a crude death rate of 15 per 1000?
a. 14 years
b. 3.5 years
c. 28 years
d. 2800 years
9. Assuming a starting size of 5.7 billion people in 1997, a population growth rate of 1.5 % per year for the human population, and unchanging demographic statistics (total fertility rate, etc.), what will the world population be in the year 2000?
a. approximately 6 billion people
b. 11.4 billion people
c. 5.8 billion people
d. 8 billion people
10. What is the demographic transition?
a. the change in total fertility rate as a country develops from an agricultural to an industrial society.
b. The migration from rural to urban centers of population.
c. A change form high levels of birth and death rates in pre-industrial societies to low levels after industrialization.
d. The change in death rates associated with famine and disease as a country moves into an idustrial age.
Back to Table of Contents